CD8+ T-cell responses towards conserved influenza B virus epitopes across anatomical sites and age
Global prevalence of HLA-B*07:02, HLA-B*08:01 and HLA-B*35:01 allomorphs
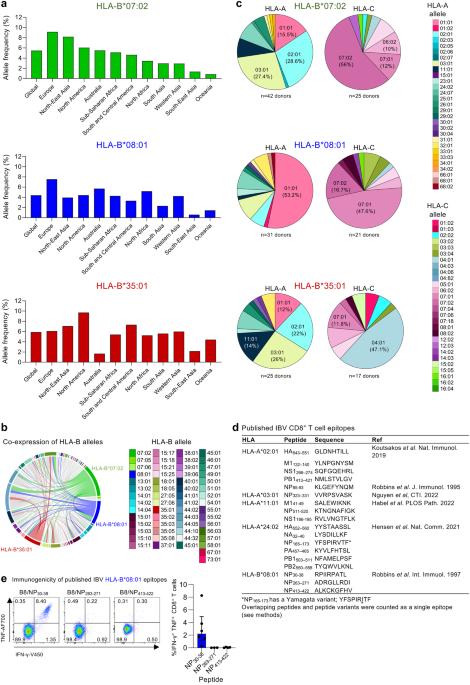
As only 18 CD8+ T cell epitopes spanning 5 HLAs have been previously described for clinically relevant and understudied IBVs 24,25,26,27,28,29, we sought to identify IBVs derived CD8+ T cell epitopes and presented by highly prevalent HLA-B*07:02, HLA-B*08:01 and HLA-B*35:01 allotypes (source: http://www.allelefrequencies.net/ accessed 3/03/2023). HLA-B*07:02 is found in 5.5% of the global population and is particularly enriched in European and North-East Asian populations (9.1% and 6.0%, respectively) (Fig. 1a). HLA-B*08:01 is present in 4.4% of the global population, with highest prevalence in Europeans (7.5%), followed by Australians (5.7%) and North African populations (5.2%) (Fig. 1a). HLA-B*35:01 is found in 5.9% of the global population, with highest prevalence in North-Americas (9.7%), followed by South and Central American populations (7.3%) and North-East Asian (7.1%) (Fig. 1a).
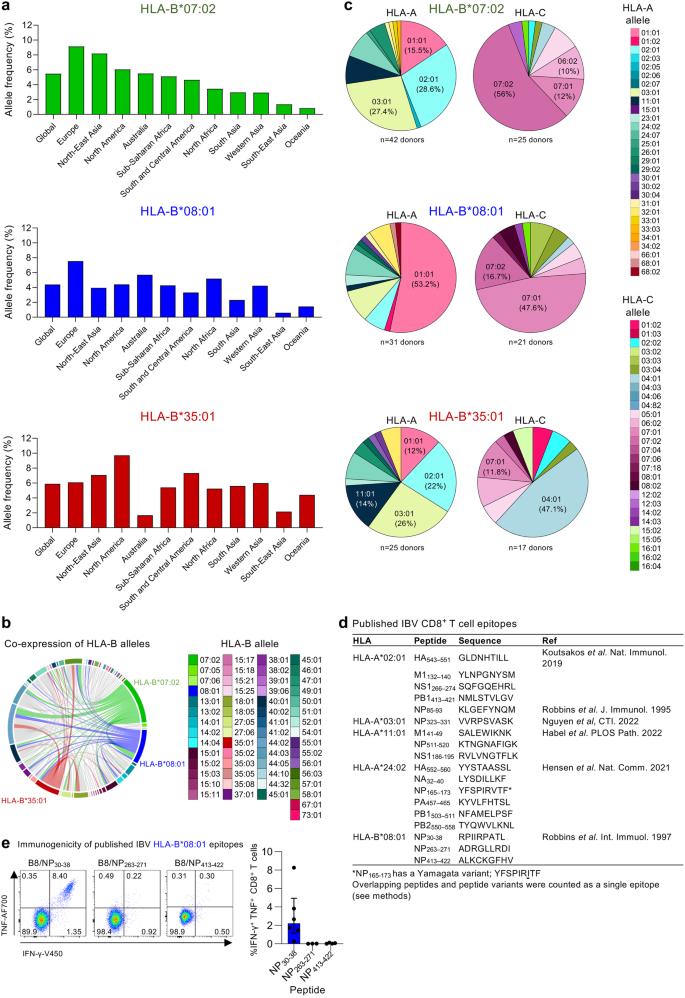
a Allele frequency of HLA-B*07:02, HLA-B*08:01 and HLA-B*35:01 according to geographical location (source: http://www.allelefrequencies.net/ accessed 3/03/2023). b Co-expression of HLA-B alleles. c Co-expression of HLA-A and C alleles with HLA-B*07:02, -B*08:01 and -B*35:01. b, c Analysis was performed using our database of healthy blood donor buffy pack (n = 185 donors). d Published IBV CD8+ T cell epitopes. e Representative FACS plots of IFN-γ and TNF expression, together with the frequency of IFN-γ+TNF+CD8+ T cells following in vitro stimulation with previously identified IBV HLA-B*08:01-restricted peptides (n = 6 donors for NP30-38, n = 3 donors for NP263-271 and n = 4 donors for NP413-422). DMSO background was subtracted. Bars represent median and interquartile range (IQR). Source data are provided as a Source Data file.
In our cohort of healthy Australians, all three HLA allomorphs of interest were broadly co-expressed with other HLA-A, B and C allomorphs. HLA-B*07:02 and B*08:01 were co-expressed in 14–18% of donors, while all three HLA allomorphs were highly co-expressed with HLA-B*44:02 (HLA-B*07:02, 16.3%; HLA-B*08:01, 12.5%; HLA-B*35:01, 16.0%) (Fig. 1b). Commonly shared co-expression allomorphs were detected for HLA-A and -C, namely HLA-A*01:01, A*02:01, A*03:01, C*07:01 and C*07:02, reflective of their prominent expression in the global population (Fig. 1c).
Based on the global frequencies and co-expressions, we concluded that any potential identified epitopes restricted to our three HLA alleles of interest would significantly increase the population coverage when included in potential T cell-based influenza vaccine strategies.
CD8+ T cell responses towards known HLA-B*08:01-restricted IBV epitopes
The 18 previously identified IBV CD8+ T cell epitopes are restricted to HLA-A*02:0124,28, HLA-A*03:0129, HLA-A*11:0125, HLA-A*24:0226 or HLA-B*08:0127 (Fig. 1d). To the best of our knowledge, no IBV CD8+ T cell epitopes have been reported for HLA-B*07:02 and HLA-B*35:01, while 3 HLA-B*08:01-restricted IBV epitopes, B8/NP30-38 (RPIIRPATL), B8/NP263-271 (ADRGLLRDI) and B8/NP413-422 (ALKCKGFHV), were identified by incubating peripheral blood mononuclear cells (PBMCs) from one donor with IBV, then screening peptides in a 51Cr cytotoxicity assay27. To understand the immunogenicity of the candidate HLA-B*08:01-restricted CD8+ T cell epitopes27, we probed PBMCs from six healthy HLA-B*08:01-expressing individuals for IBV-specific CD8+ T cell responses using our in vitro peptide expansion approach combined with intracellular cytokine staining (ICS) for IFN-γ/TNF production24,25,26,32 (Fig. 1e and Supplementary Fig. 1). Robust IFN-γ+TNF+ CD8+ T cell responses were observed for PBMCs stimulated with the NP30-38 peptide across all HLA-B*08:01 donors (median of 2.2%), while no responses were detected for NP263-271 and NP413-422 (Fig. 1e), consistent with findings by others20.
Overall, there remains a paucity of data on IBV-specific CD8+ T cell epitopes across predominant class I HLAs.
Identification of IBV-derived peptides presented by HLA-B*07:02, -B*08:01 or -B*35:01
To identify IBV peptides presented by HLA-B*07:02, HLA-B*08:01 or HLA-B*35:01, we used our well-established immunopeptidomics methodology24,25,26. HLA-B*07:02-, HLA-B*08:01- or HLA-B*35:01-expressing C1R cell lines were infected with IBV (B/Malaysia/2506/04) for 12 h followed by HLA-I isolation using the pan HLA-I antibody W6/32 and analyzed by liquid chromatography-tandem mass spectrometry (LC-MS/MS). Human proteome derived peptides identified at a 1% false discovery rate (FDR) were consistent in length with HLA-I ligands. All datasets were dominated by 9-mer peptides (Fig. 2a), with HLA-B*08:01 also showing a high prevalence of 8-mer peptides which has been reported before33. HLA-B*07:02 and HLA-B*35:01 shared a preference for Proline at P2, while at PΩ (the C-terminal amino acid), B*07:02 showed a hierarchy of Leu»Phe/Val/Met/Ile and B*35:01 of Tyr>Leu/Phe/Met (Fig. 2b). In contrast, HLA-B*08:01 showed enrichment of positively charged amino acids (Arg and Lys) at P5 and, to a lesser extent, P3 of both 8- and 9-mer peptides, with Leu dominating PΩ. All of these anchor residues are consistent with previous findings34.
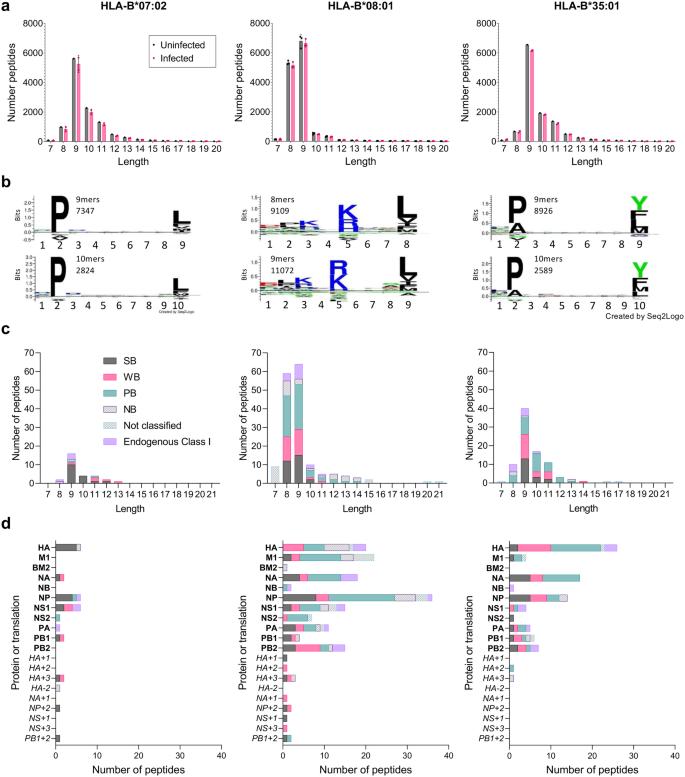
a Length distribution of human proteome-derived peptides (non-redundant by sequence) identified at an FDR of 1% from immunopurification of HLA class I (using the pan HLA-I antibody W6/32) of C1R.B*07:02, C1R.B*08:01 and C1R.B*35:01. All data sets were filtered for peptides identified from the endogenous HLA-C*04:01 and HLA class II of C1R cells from previous experiments24,26, and peptides identified as possessing the HLA-C*04:01 binding motif via Gibbs cluster analysis. The C1R.B*08:01 data sets were also filtered of peptides isolated using W6/32 from the endogenous HLA-I of C1R. Human proteome derived peptides from uninfected and infected replicates are shown in black and pink, respectively. Points represent individual replicates, bars represent the mean number of peptides, error bars are standard deviation. Numbers of replicates: C1R.B*07:02—1 uninfected, 2 B/Malaysia infected; C1R.B*08:01—3 uninfected, 3 B/Malaysia infected; C1R.B*35:01—1 uninfected, 2 B/Malaysia infected. b Sequence motifs of preferred lengths for HLA-B*07:02 (9 and 10), HLA-B*08:01 (8 and 9) and HLA-B*35:01 (9 and 10). Motifs are based on human peptides of these lengths represented in (a). Motifs were made using Seq2Logo. c Length and (d) proteome (and alternative translation frame product; italicized) distribution of influenza B-derived peptides isolated in experiments using C1R.B*07:02, C1R.B*08:01 or C1R.B*35:01. Peptides predicted to bind the overexpressed HLA are denoted as strong binders (SB), weak binders (WB) or possible binders (PB) as per Supplementary Data 1. Peptides isolated in experiments that were not predicted to bind the overexpressed HLA are separated into the following categories: non-binder (NB)—8–14 amino acids in length and not predicted to bind any HLA expressed, Endogenous Class I—predicted to bind endogenous HLA class I of C1R as described in Supplementary Data 1, not classified—14 amino acids length therefore binding prediction not performed. Source data are provided as a Source Data file.
To identify IBV peptides, a 5% peptide FDR was employed to minimize exclusion of flu derived peptides, with the data from uninfected cells utilized as an additional filter for false discovery24,25,26. IBV peptide sequences identified in isolations from HLA class II of C1R were excluded, however all other peptides were retained in the analysis and their predicted binding to both the transfected and endogenous HLA-I calculated with NetMHC4.0 (Supplementary Data 1). Twenty-four, 114, and 71 IBV peptide sequences were identified as binders of HLA-B*07:02, HLA-B*08:01 and HLA-B*35:01, respectively (Fig. 2c). For all three transfectant HLA-I, the length distribution of IBV peptides mirrored that observed for human peptides, dominated by 9-mers, with the HLA-B*08:01 data set also containing a large proportion of 8-mer peptides (Fig. 2c). Broad sampling of the IBV proteome was observed for HLA-B*08:01 and HLA-B*35:01, dominated by NP, NA, M1, HA, PB2, and NS1 for HLA-B*08:01, and HA, NA, and NP for HLA-B*35:01 (Fig. 2d). HLA-B*07:02 sampled NP, HA, NS1, PB1, NA and NS2. We also identified potential peptide binders from alternative reading frames for all three HLAs, including NP + 2180-188 and PB1 + 280-89, which were common to HLA-B*07:02 and HLA-B*08:01.
The three previously identified HLA-B*08:01-restricted IBV peptides (NP30-38, NP263-271 and NP413-422) were all conserved in B/Malaysia/2506/04, however, only NP30-38 (RPIIRPATL) was identified in our immunopeptidome data, consistent with the observed lack of CD8+ T cell response towards NP263-271 and NP413-421 (Fig. 1e)20. NP30-38 was also one of eight peptides identified as a ligand for both HLA-B*07:02 and -B*08:01, despite their disparate binding motifs (Supplementary Data 1). Furthermore, NP30-38 was also not an HLA-B*35:01 ligand despite having anchor residues consistent with other -B*35:01 ligands (Fig. 2b).
A selection of 21 HLA-B*07:02 peptides and 55 HLA-B*35:01 peptides were chosen for immunogenicity screening in vitro based on a combination of high quality of peptide identification and binding prediction for the transfected HLA-I. NP30-38 was also included as a potential HLA-B*35:01 peptide due to its anchor residues. For HLA-B*08:01, selections were further focused on in frame proteins, with 35 HLA-B*08:01 peptides selected for screening, including NS211-19 due to strong binding prediction despite identification at >5% FDR (Supplementary Data 1).
Identification of immunogenic IBV-specific HLA-B*07:02-, HLA-B*08:01- and HLA-B*35:01-restricted IBV peptides
To define CD8+ T cell immunogenicity towards our LC-MS/MS-identified IBV-derived peptides, we assigned those 112 peptides into 7 HLA specific peptide pools based on increasing predicted binding affinity towards their respective HLA (Supplementary Table 1). PBMCs obtained from healthy HLA-B*07:02-, HLA-B*08:01- or HLA-B*35:01-expressing individuals (Supplementary Table 2) were stimulated with their respective peptide pools for 10–12 days in vitro, followed by re-stimulation with the respective pool to measure IFN-γ and TNF production (Fig. 3a). CD8+ T cells responding to specific pools were further dissected using individual IBV-derived peptides.
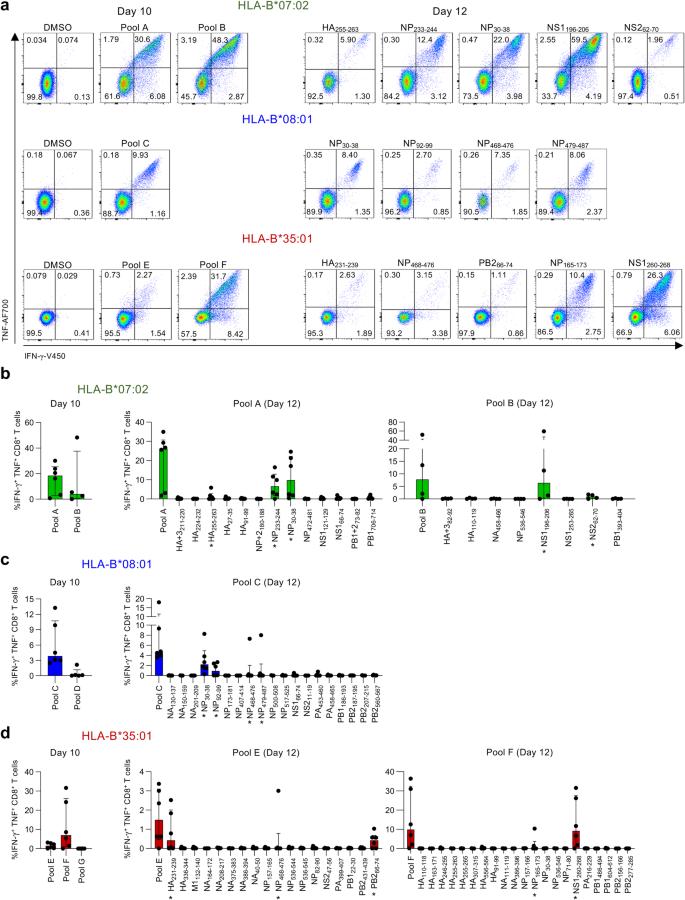
a Representative FACS plots of IFN-γ+TNF+ CD8+ T cells restimulated with peptide pools or individual IBV peptides. b Frequency of IFN-γ+TNF+ CD8+ T cells after restimulation with HLA-B*07:02-restricted peptide pool A (n = 6 donors) or B (n = 4 donors) and individual HLA-B*07:02 IBV peptides (n = 4 donors for pool A and n = 6 donors for pool B). c Frequency of IFN-γ+TNF+ CD8+ T cells after restimulation with HLA-B*08:01-restricted pool C (n = 6 donors) or D (n = 5 donors) and individual HLA-B*08:01 IBV peptides (n = 6 donors). d Frequency of IFN-γ+TNF+ CD8+ T cells after restimulation with HLA-B*35:01-restricted pool E, F, G and individual HLA-B*35:01 IBV peptides (n = 6 donors). Median and interquartile range (IQR) are shown. DMSO background was subtracted. Source data are provided as a Source Data file.
For HLA-B*07:02, both pool A and B stimulated IFN-γ and TNF production (Fig. 3b). Dissection of pool A and B identified five immunogenic HLA-B*07:02 peptides; NP30-38, NP233-244, NS1196-206, NS262-70 and HA255-263 responses in 5/6, 5/6, 3/4, 2/4, 2/4 donors respectively. For HLA-B*08:01, pool C stimulated IFN-γ and TNF production but not pool D (Fig. 3c and Supplementary Fig. 2a). Dissection of pool C revealed four immunogenic HLA-B*08:01 peptides; NP30-38 and NP92-99 responses in 5/6 and 3/6 donors respectively, whereas NP479-487 and NP468-476 induced a robust IFN-γ+TNF+CD8+ T cell response in one individual. HLA-B*35:01-derived pools E and F stimulated IFN-γ and TNF production, but not pool G (Fig. 3d and Supplementary Fig. 2a). Dissection of pools E and F identified five immunogenic HLA-B*35:01 peptides; NS1260-268, HA231-239, PB266-70 NP165-173 and NP468-476 responses in 4/6, 3/6, 4/6, 2/6 and 1/6 donors, respectively. Two donors responding to NP165-173 also expressed HLA-A*24:02.
Overall, we identified 13 immunogenic IBV peptides in HLA-B*07:02- (5 peptides), HLA-B*08:01- (3 peptides) and HLA-B*35:01- (5 peptides) expressing individuals. The NP30-38 peptide was of particular interest as it was immunogenic in both HLA-B*07:02 and/or HLA-B*08:01-expressing donors, but no responses were observed for HLA-B*35:01-expressing donors (pool G; Fig. 3d).
Verification of HLA restriction for the immunogenic IBV-derived peptides
Following identification of IBV-derived immunogenic peptides in HLA-B*07:02-, HLA-B*08:01- and HLA-B*35:01-expressing individuals, we subsequently verified the HLA restriction for the identified IBV peptides to rule out any potential peptide presentation by unrelated HLA alleles co-expressed in our donors. Particularly the B*35:01 associated NP165-173 peptide only generated responses in HLA-A*24:02+ and HLA-B*35:01+ individuals and was previously identified as an HLA-A*24:02-restricted epitope by our group26. We generated three new peptide pools consisting of 5 immunogenic HLA-B*07:02 peptides (pool H), 4 immunogenic HLA-B*08:01 peptides (pool I) and 5 immunogenic HLA-B*35:01 peptides (pool J) (Supplementary Table 3), for stimulating CD8+ T cells. Pool-specific CD8+ T cells were restimulated with C1R cell lines expressing HLA-B*07:02, HLA-B*08:01 or HLA-B*35:01 molecules which were pulsed with individual peptides from the corresponding pool and stained for IFN-γ/TNF production (Fig. 4a). Pool-specific CD8+ T cells were also restimulated with peptide-pool pulsed parental C1Rs to control for the low expression of HLA-B*35:03 and HLA-C*04:01 by C1Rs, which may elicit CD8+ T cell responses specific for those peptide-HLA (pHLA) combinations35.
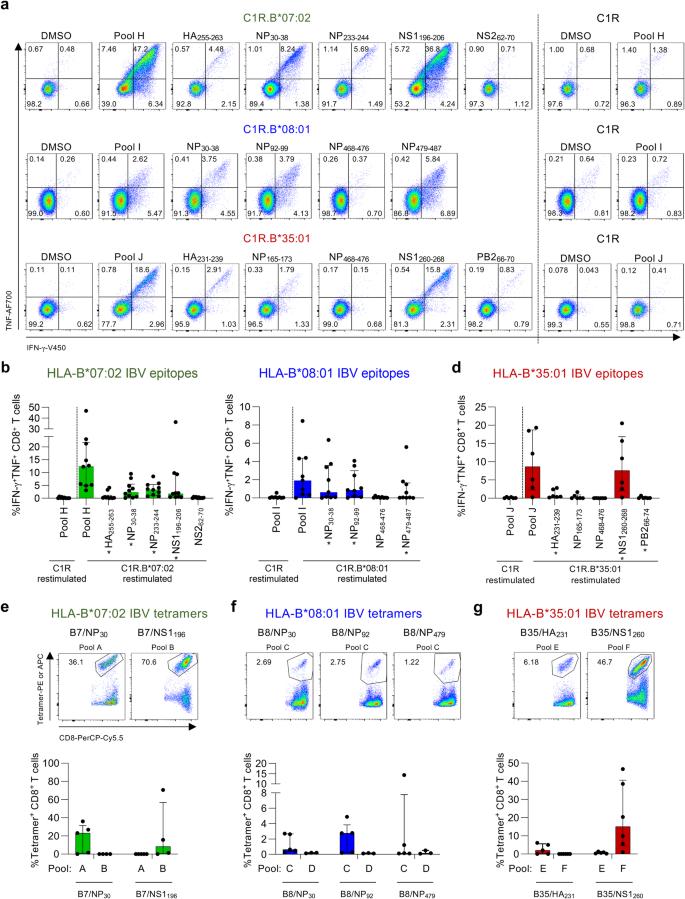
a Representative FACS plots of IFN-γ and TNF production by CD8+ T cells after restimulation with C1R.B*07:02, C1R.B*08:01, C1R.B*35:01 or C1R cells pulsed with immunogenic IBV peptides or pools. Frequencies of IFN-γ+TNF+CD8+ T cells after restimulation with IBV peptide pulsed (b) C1R.B*07:02 (n = 10 donors), (c) C1R.B*08:01 (n = 9 donors) or (d) C1R.B*35:01 (n = 6 donors). b–d * indicate identified epitopes. DMSO background was subtracted. Frequencies and representative FACS plots of in vitro expanded IBV-specific CD8+ T cells stained with our generated (e) B7/NP30-38 (named B7/NP30) and B7/NS1196-206 (B7/NS1196) tetramers (n = 5 donors for pool A and n = 4 donors for pool B), (f) B8/NP30-38 (B8/NP30), B8/NP92-99 (B8/NP92) and B8/NP479-587 (B8/NP479) tetramers (n = 5 donors for pool C and n = 3 donors for pool D), and (g) B35/HA231-239 (B35/HA231) and B35/NS1260-268 (B35/NS1260) tetramers (n = 5 donors for pool E and n = 6 donors for pool F). Bars represent median and IQR. Overlapping peptides and peptide variants were counted as a single epitope (see “Methods”). Source data are provided as a Source Data file.
We verified the HLA*07:02 restriction of peptides NP233-244 (response in 9/10 donors), NP30-38 (7/10 donors), NS1196-206 (6/10 donors) and HA255-263 (2/10 donors), but detected no responses towards NS262-70 (Fig. 4b). We verified the HLA-B*08:01 restriction for IBV-derived NP92-99 (6/9 donors) and NP479-487 (4/9 donors) peptides and confirmed the HLA-B*08:01 restriction for NP30-38 (5/9 donors) (Fig. 4c). No responses were identified against NP468-476. HLA-B*35:01-restriction was verified for NS1260-268 (5/6 donors), HA231-239 (3/6 donors) and PB266-70 (1/6 donors) peptides, while no responses were detected for NP468-476 peptide (Fig. 4d). Weak IFN-γ+TNF+CD8+ T cell responses for NP165-173 were only observed in HLA-B*35:01 donors who co-expressed HLA-A*24:02 (A5 and A17; Supplementary Table 2). We hypothesize that HLA-A*24:02 co-expression may result in HLA-B*35:01/NP165-173 (B35/NP165-173)-cross-reactive CD8+ T cell responses. Therefore, NP165-173 was not considered as a true HLA-B*35:01-restricted IBV epitope.
HLA-restriction was further validated using peptide pHLA-I tetramer staining for 7 IBV epitopes that elicited the strongest IFN-γ+TNF+ CD8+ T cell responses (Fig. 4a–d) and displayed >99% conservation among IBVs circulating in the human population between 1940 and 2023 (Table 1 and Supplementary Data 2). This included 2 HLA-B*07:02 (B7/NP30, B7/NS1196), 3 HLA-B*08:01 (B8/NP30, B8/NP92, B8/NP479) and 2 HLA-B*35:01 (B35/HA231, B35/NS1260) tetramers. Prominent tetramer-staining was observed in IBV-specific CD8+ T cell lines that were expanded with their respective original peptide pool (A-G) (Fig. 4e–g). CD8+ T cells expanded with an unrelated peptide pool were used as a negative control. B35/NS1260-specific CD8+ T cells had a higher frequency of tetramer+CD8+ T cells compared to the frequency of IFN-γ+TNF+ CD8+ T cells following IBV peptide stimulation (Supplementary Fig. 2b), suggesting that not all IBV epitope-specific CD8+ T cells secrete both IFN-γ and TNF cytokines. Other IBV-specific CD8+ T cell populations stained with their respective tetramers also displayed a similar trend.
Overall, we identified 9 IBV CD8+ T cell epitopes, with 4 restricted to HLA-B*07:02, 2 restricted to HLA-B*08:01 and 3 restricted to HLA-B*35:01, and confirmed the HLA-B*08:01 restriction of the previously identified NP30-38. Our study increases the overall number of known IBV CD8+ T cell epitopes by 50% as well as covering 2 additional prominent HLAs, HLA-B*07:02 and HLA-B*35:01. Of note, our newly-identified IBV epitopes were not conserved among IAV strains as we were unable to identify overlapping sequences within IAV proteins.
Robust ex vivo frequencies of IBV-specific CD8+ T memory populations in healthy donors
To probe the magnitude of IBV-specific CD8+ T cell populations directly ex vivo, we used tetramer-associated magnetic enrichment (TAME)36 in PBMCs from 22 HLA-B*07:02+, 19 HLA-B*08:01+ and 11 HLA-B*35:01+ healthy donors (Fig. 5, Supplementary Fig. 3a and Supplementary Table 2). Substantial tetramer+CD8+ T cell populations were directed against B7/NP30-38 (median frequency of 1.90 × 10⁻⁵), B7/NS1196-206 (2.65 × 10⁻⁵), B8/NP30-38 (9.50 × 10⁻⁶), B8/NP92-99 (2.35 × 10⁻⁵), B35/HA231-239 (1.70 × 10⁻⁵) and B35/NS1260-268 (6.77 × 10⁻⁵) epitopes (Fig. 5a, b). These magnitudes were comparable to previously published ex vivo IBV-specific CD8+ T cell frequencies for HLA-A*02:01- and HLA-A*24:02-restricted IBV-epitopes24,26. B35/NS1260+CD8+ T cell frequencies (6.77 × 10⁻⁵) were higher than B8/NP30+CD8+ (9.50 × 10⁻⁶) and B8/NP479+CD8+ (2.74 × 10⁻⁶) T cell frequencies (p = 0.0145 and p = 0.0017, respectively). Low prevalence of B8/NP479+CD8+ T cells was evident and 7/11 donors had 479+CD8+ T cells, thus this epitope was not studied beyond phenotypic analysis.
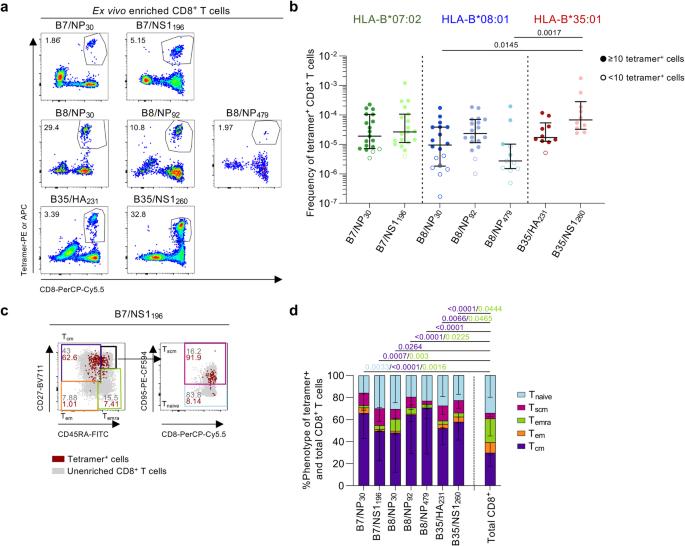
a Representative FACS plots of enriched IBV-specific CD8+ T cells. b Frequency of B7/NP30+CD8+ T cells (n = 19 donors), B7/NS1196+CD8+ T cells (n = 19), B8/NP30+CD8+ T cells (n = 18), B8/NP92+CD8+ T cells (n = 18), B8/NP479+CD8+ T cells (n = 11), B35/HA231+CD8+ T cells (n = 10 donors) and B35/NS1260+CD8+ T cells (n = 10). Open symbols represent + cells counted, excluded from phenotypic analysis. Bars represent median and IQR. c Representative FACS plots of the gating strategy to identify phenotypic populations Tcm (CD27+CD45RA−) cells, Tem (CD27−CD45RA−), Temra (CD27−CD45RA+), Tnaïve (CD27+CD45RA+CD95−) and Tscm (CD27+CD45RA+CD95+) cells. Gray dots represent total CD8+ T cells in the unenriched sample, red dots are IBV-specific CD8+ T cells in the enriched sample. d Proportion of memory phenotypes for each IBV-specific CD8+ T cell population and total CD8+ T cells (n = 16 donors; B7/NP30, n = 18; B7/NS1196, n = 11; B8/NP30, n = 16; B8/NP92, n = 4; B8/NP479, n = 9; B35/HA231, n = 10; B35/NS1260, n = 43; Total CD8+ T cells). Bars represent mean and standard deviation (SD). Statistical significance was determined with using a two-sided Kruskal–Wallis with Dunn’s test for multiple comparisons (b) or two-way ANOVA with two-sided Tukey’s test for multiple comparisons (d). Source data are provided as a Source Data file.
To define ex vivo phenotype of IBV-specific tetramer+CD8+ T cells, we analyzed expression of CD27, CD45RA and CD95 to discriminate between central memory (Tcm; CD27+CD45RA−), effector memory (Tem; CD27−CD45RA−), terminally differentiated effector memory (Temra; CD27−CD45RA+), stem cell memory (Tscm; CD27+CD45RA+CD95+) and naive (Tnaive; CD27+CD45RA+CD95−) CD8+ T cell phenotypes (Fig. 5c). Cell populations with +CD8+ T cells were excluded from phenotypic analyses37. Tcm phenotype was more enriched in IBV-specific CD8+ T cells compared to total CD8+ T cells, whereas Temra phenotype was less prominent (Fig. 5d).
Overall, our findings provide evidence for substantial ex vivo pools of IBV-specific tetramer+CD8+ T cells circulating in peripheral blood and expressing predominantly memory Tcm phenotype in healthy adults.
IBV-specific CD8+ T cell responses decline with age
CD8+ T cells directed towards IAV-derived epitopes substantially change throughout the human lifespan at numerical, phenotypic and transcriptomic levels38,39,40. An unanswered question remains how IBV-specific CD8+ T cells change throughout immunologically-distinct phases of life, especially given age-related IBV disease severity7,8,9. We sought to define the magnitude and phenotype of IBV-specific CD8+ T cells across three age groups (6 children 60 years) (Fig. 6a). Pooled analysis revealed that IBV-specific CD8+ T cell responses peaked in adults and declined in the elderly (Fig. 6b). Similar trends were observed within HLA-B*07:02+ donors and HLA-B*08:01+ donors but could not be confirmed in HLA-B*35:01+ individuals, due to the lack of available elderly HLA-B*35:01+ donors (Fig. 6c).
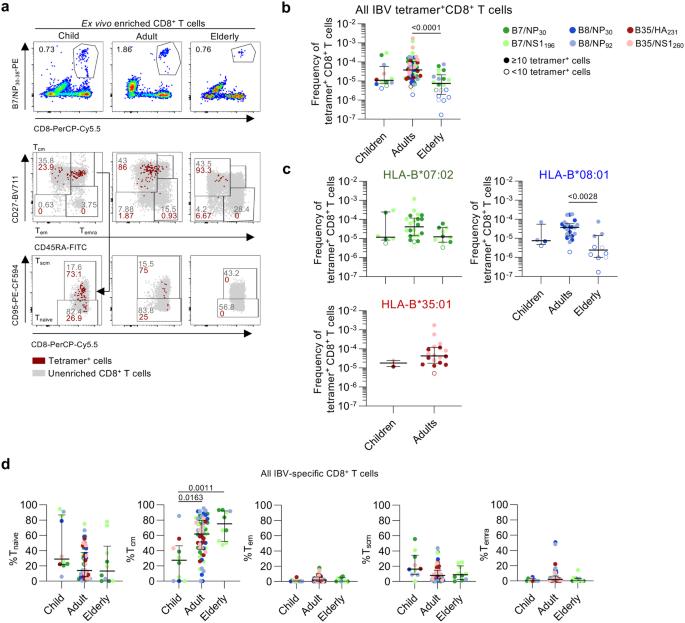
a Representative FACS plots of B7/NP30+CD8+ T cells across age. b Frequency of pooled IBV-specific CD8+ T cells across age groups (n = 43 donors). Colors represent different tetramers. Open symbols represent + cells counted. c Frequency of HLA-B*07:02 (n = 19 donors), -B08:01 (n = 18) and -B35:01-restricted (n = 10) IBV-specific CD8+ T cells across age grouped by HLA (n = 10–19 donors). Colors represent different tetramers. Open symbols represent + cells counted. d Proportions of phenotypes of IBV-specific CD8+ T cells in children, adults and elderly donors for all IBV tetramer+ populations (n = 38 donors). b–d Statistical significance was determined using a two-sided Kruskal–Wallis with Dunn’s test for multiple comparisons for pooled and HLA-B*07:02 and HLA-B*08:01 tetramers and (c) two-sided Mann–Whitney U test for HLA-B*35:01 tetramers. Bars represent median and IQR. Source data are provided as a Source Data file.
Phenotypic analysis revealed that Tcm frequencies of pooled IBV-specific tetramer+CD8+ T cells increased with age and peaked in the elderly (median Tcm frequency in children 27.4%, adults 61.9%, elderly 75.2%) (Fig. 6d), which was also observed for HLA-B*07:02-restricted IBV tetramer+CD8+ T cells (Supplementary Fig. 3b). This was in agreement with our recent observation for IAV-specific CD8+ T cells directed at the HLA-A*02:01-restricted M158-66 (A2/M158) epitope41. In contrast, total CD8+ Tcm populations were stable with age while the Tnaive population decreased with age and Temra/Tem cells increased (Supplementary Fig. 3c), in line with previous reports39,41.
In summary, despite maintaining a predominant Tcm phenotype across the human lifespan, IBV-specific CD8+ T cell populations decline in magnitude with age.
IBV-specific CD8+ T cells in human tissues express a tissue resident phenotype
Thus far, we have focussed on IBV-specific CD8+ T cells within peripheral blood. However, tissue-resident memory T (Trm) cell populations are important for protective immunity, especially towards respiratory viral infections42. Mouse models show lung-resident T cells protect against severe influenza disease outcomes43,44. We thus assessed the prevalence and phenotype of IBV-specific CD8+ T cells in human lungs (n = 6 donors), mesenteric lymph nodes (LN; n = 11) and spleens (n = 15) from deceased donors and tonsils (n = 15) from routine tonsillectomies (Supplementary Table 2).
Median frequencies of pooled IBV tetramer+CD8+ T cells ranged between 1.63 × 10⁻⁵ and 1.40 × 10⁻⁴ in human tissues, with higher frequencies in LN (1.40 × 10⁻⁴) and tonsils (3.84 × 10⁻⁵) compared to spleen (1.63 × 10⁻⁵) (Fig. 7a). LN frequencies were also higher than PBMCs (2.56 × 10⁻⁵). Similar trends were observed for HLA-B*07:02-restricted IBV tetramer+CD8+ T cells, albeit not significant.
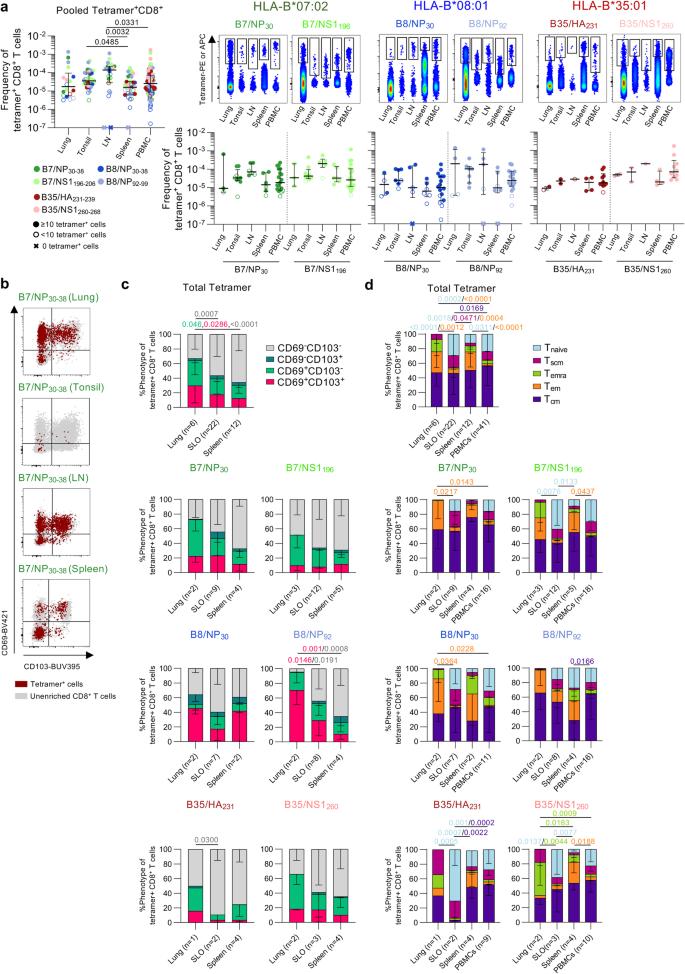
a Frequencies of total IBV-specific CD8+ T cells in human lungs (n = 6 donors), tonsils (n = 15), lymph nodes (n = 11), spleen (n = 15) and PBMCs (n = 43). Representative concatenated FACS plots of enriched IBV-specific CD8+ T cells and frequency of individual tetramer+CD8+ T cells across PBMCs, LN, tonsils, spleen and lung. Open symbols represent + cells counted. “x” symbols represent 0 tetramer+ cells. b Representative FACS plots of CD69 and CD103 expression in IBV-specific CD8+ T cells from different tissues. c Proportions of CD69 and CD103 expressing subsets for total IBV-specific CD8+ T cells (n = 36 donors) and individual tetramer+CD8+ T cell populations across different tissues (lungs, SLOs and spleen). d Proportions of memory phenotypes of total IBV-specific CD8+ T cells (n = 36 donors) and individual tetramer+CD8+ T cell populations across different tissues. a Bars represent median and IQR. c, d Bars represent mean and SD. Statistical significance was determined using a two-sided Kruskal–Wallis with Dunn’s test for multiple comparisons (a) or two-way ANOVA with two-sided Tukey’s test for multiple comparisons (c, d). Source data are provided as a Source Data file.
To establish whether IBV tetramer+CD8+ T cells in human tissues displayed a Trm phenotype, we assessed CD69 and CD103 expression on IBV tetramer+CD8+ T cells in lungs, secondary lymphoid organs (SLOs; tonsils and LN) and spleens (Fig. 7b). Higher proportions of CD69+CD103+ and CD69+CD103− Trm were detected within the pooled IBV tetramer+CD8+ T cell population in lungs (29.9% and 34.4%, respectively) compared to spleen (12.3% and 18.1%, respectively), which was associated with lower CD69−CD103− subset in lungs (33.1%) compared to spleens (65.8%) and secondary lymphoid organs (SLOs; 56.4%) (Fig. 7c). Similar trends were observed for individual IBV tetramer+CD8+ T cells albeit not significant, except for B8/NP92+CD8+ T cells.
Higher Tem populations in pooled and individual IBV tetramer+CD8+ T cells were mainly observed in the lung and spleen compared to circulating IBV tetramer+CD8+ T cells, while Tnaive populations were mainly detected in SLOs and in circulation (Fig. 7d), in line with the expected trafficking patterns of these memory T cell subsets45,46. When analyzing individual tetramer+CD8+ T cells, the pattern of memory phenotypes for each tissue matched the overall IBV-specific CD8+ T cell population.
LN and spleen samples obtained from the same individuals (n = 12 donors) were analyzed to assess organ-related differences in IBV-specific CD8+ T cell frequency and phenotype within these individuals (Supplementary Fig. 4). Higher frequencies of IBV tetramer+CD8+ T cells, both pooled and individual responses, were detected in LN (median 1.4 × 10⁻⁴) compared to spleens (median 1.52 × 10⁻⁵). Likewise, proportions of IBV-specific CD69+CD103+CD8+ Trm were higher in the LN (median 19.7%) compared to spleens (median 5.0%), albeit not significant.
Overall, we identified prominent IBV tetramer+CD8+ Trm cell populations in five human tissues demonstrating that IBV tetramer+CD8+ T cells are poised to provide protection at the site of IBV infection (lung). We also show that IBV-specific tetramer+CD8+ T cells are found at a higher frequency in LNs compared to spleen but are not necessarily resident within the LN.
B*07:02-restricted 11 amino acid long NS1196-206 peptide bulges out of the peptide-binding cleft
Although representing approximately 11% of HLA-B*07:02 ligands (Fig. 2a), 11mer peptides such as, the NS1196-206 peptide are considered long with regards to the structural constraints of the HLA-I binding cleft47. Long peptides can either have N or C terminal overhangs48 or bulge out of the HLA-peptide binding cleft eliciting either highly restricted49 or diverse TCR repertoires50, which can be associated with lower epitope-specific CD8+ T cell frequencies when associated with higher mobility32. To establish whether the NS1196-206 peptide also bulges out of the HLA-B*07:02 peptide binding cleft, we crystallized and solved the structure of HLA-B*07:02-NS1196-206 at a resolution of 2.4 Å (Fig. 8a and Supplementary Table 4). Structural analysis showed that the peptide NS1196-206 interacts with hydrogen bonds to side chain residues of HLA α1 and α2 helices. Considering the anchor residues at the extremities of the peptide (P2 and PΩ), the 11-mer peptide bulged out from central P4-Gly to P8-Leu to adopt stable conformation and providing a surface for TCR recognition. In terms of HLA-I and peptide specificity, polymorphic residues Asp-114, and Glu-152 form hydrogen bonds with the side chain of P6-Lys and P9-Ser, respectively (Fig. 8a). Accordingly, the NS1196-206 epitope forms a stable conformation that bulges out of the HLA-B*07:02 cleft, which is in accordance with the relatively robust B7/NS1196-specific CD8+ T cell frequencies (Fig. 5b).
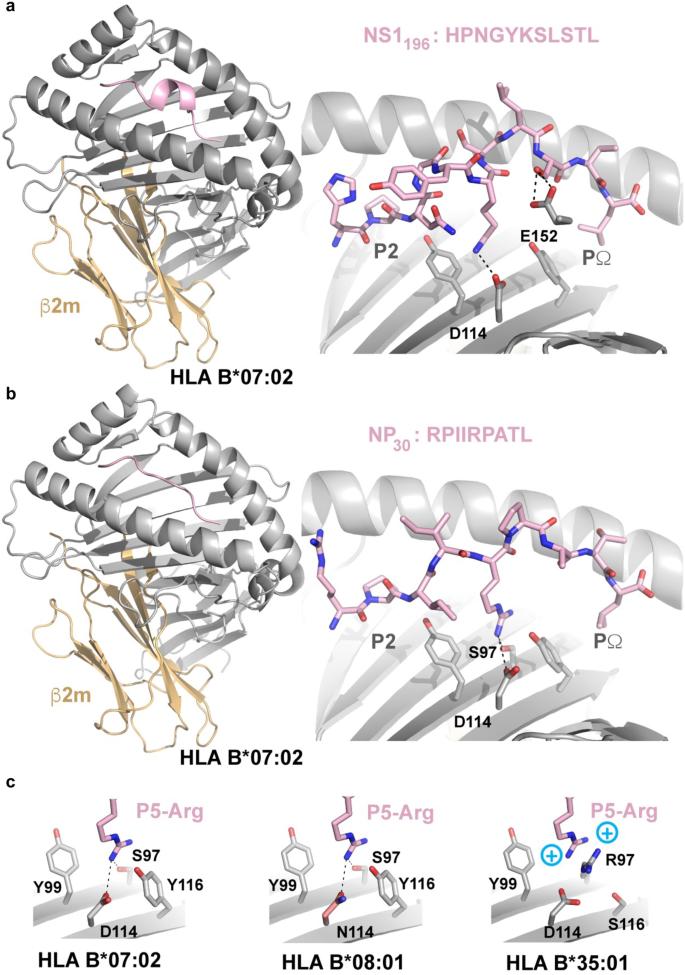
a Crystal structure of HLA-B*07:02-NS1196-206 where HLA-B*07:02 is represented as an gray/orange cartoon while NS1196-206 is represented as pink sticks. b Cartoon representation of the crystal structure of the NP30-38 peptide when presented by HLA-B*07:02 (color coding as in (a)) with the positions of the P2 and PΩ labeled. Key residues interacting with the P5-Arg are labeled. c Overlay of the P5-Arg pockets in HLA-B*07:02, -B*08:01 and -B*35:01 demonstrating polymorphisms incompatible with the downward P5-Arg.
Presentation of NP30-38 in the context of HLA-B*07:02
We sought to assess whether structural differences of NP30-38 bound by HLA-B*07:02 or HLA-B*08:01 allomorphs could underpin similarities or differences in the responding TCR repertoires. Antigen presentation of NP30-38 (RPIIRPATL) peptide bound to HLA-B*07:02-NP30-38 was assessed after obtaining a 2.2 Å resolution structure (Fig. 8b, c). Canonical TCR-docking modes often focus heavily near the mid-point of the α1/2 helices such that central epitope residues play a key role in TCR recognition. Within the HLA-B*07:02-NP30-38 complex the P5-Arg is directed towards the HLA platform leaving the P3 and P4-Ile and P6-Pro as likely determinants for T cell engagement (Fig. 8b). HLA-B*07:02 shares 95% sequence identity with HLA-B*08:01, but a significant point-of-difference is an Asp114Asn polymorphism. Superposing the HLA-B*08:01 structure with HLA-B*07:02-NP30-38 indicates that Asn-114 is capable of accepting the platform-directed P5-Arg within HLA B*08:01 (Fig. 8c) with minimal changes.
Since NP30-38 has anchor residues that match the HLA-B*35:01 binding motifs (Fig. 2b), we sought a structural explanation of why we could not detect HLA-B35:01/NP30+CD8+ T cell responses (Fig. 3d). Superposing HLA-B*35:01 with HLA-B*07:02-NP30-38 shows that presence of the Arg97 polymorphism within the HLA-B*35:01 allomorph would align a positively charged HLA residue at a similar position to that of P5-Arg from within the NP30-38 epitope. Repulsion of like-charges may limit peptide binding (Fig. 8c) or require significant changes to epitope conformation for this pHLA combination.
Overall, the structural analyses indicated the NP30-38 peptide can be accommodated with both HLA-B*07:02 and HLA-B*08:01. However, allele specific polymorphisms may result in structural differences of NP30-38 presentation depending on the allomorph. Our data also suggested that NP30-38 would form a stable interaction with HLA-B*35:01, providing a potential explanation as to why no HLA-B*35:01/NP30+ CD8+ T cell response was detected against this allomorph.
Distinct TCRαβ repertoires are elicited towards B7/NP30 and B8/NP30 epitopes
Given the presentation of the IBV NP30-38 peptide by HLA-B7:02 and HLA-B*08:01, we asked whether B7/NP30+CD8+ and B8/NP30+CD8+ T cell responses consisted of cross-reactive TCRαβ clonotypes. To this end, we co-stained PBMCs obtained from HLA-B*07:02 and HLA-B*08:01 double-positive and single-positive individuals with B7/NP30-PE and B8/NP30-APC tetramers (Fig. 9a). Although we identified single-positive B7/NP30+CD8+ and/or B8/NP30+CD8+ T cells across all individuals, we did not detect any cross-reactive double-positive B7/NP30+B8/NP30+CD8+ T cells. This suggests a lack of shared TCRs directed towards B7/NP30+CD8+ and B8/NP30+CD8+ T cells. We identified no significant differences in B7/NP30+ or B8/NP30+ CD8+ T cell frequencies between HLA-B*07:02 and HLA-B*08:01 single-positive and double-positive individuals, however a trend for lower frequencies was observed in HLA-B*08:01-expressing donors (Supplementary Fig. 5a). A phenotypic comparison of B7/NP30- and B8/NP30-specific CD8+ T cell populations in HLA-B*07:02 and HLA-B*08:01 single-positive and double-positive individuals revealed a prominent B7/NP30 Tcm population in HLA-B*07:02-expressing donors regardless of HLA-B*08:01 co-expression, while a visually apparent but statistically indistinguishable trend for higher B8/NP30 Tcm frequencies was observed for HLA-B*08:01-expressing donors versus double-positive donors (Supplementary Fig. 5b). These results indicate that co-expression of HLA-B*07:02 and HLA-B*08:01 may result in lower recruitment of B8/NP30+CD8+ T cells, which could potentially be explained by the slightly reduced binding affinity of NP30-38 to HLA-B*08:01 compared to HLA-B*07:02 (Supplementary Data 1). Since TCRαβ repertoire diversity and clonal composition affect functionality of epitope-specific CD8+ T cells32,41,51, we dissected the B7/NP30+CD8+ and B8/NP30+CD8+ TCRαβ repertoires and compared those with TCRαβ signatures within other immunodominant HLA*B*07:02- and HLA-B*08:01-restricted CD8+ T cell epitopes, namely B7/NS1196-206 and B8/NP92-99. Overall, we analyzed 236 paired TCRαβ clonotypes, 23 single TCRα and 148 TCRβ chains. For each epitope, an average of 55 TCRαβ clonotypes were analyzed across 5-6 donors (Supplementary Tables 6–9). 2D kernel principal component analysis (kPCA) projections of the TCR Vα, Vβ, Jα and Jβ gene segment landscape revealed that the overall TCRαβ repertoire of HLA-B*07:02- and HLA-B*08:01-restricted IBV epitopes was highly diverse (Fig. 9b).
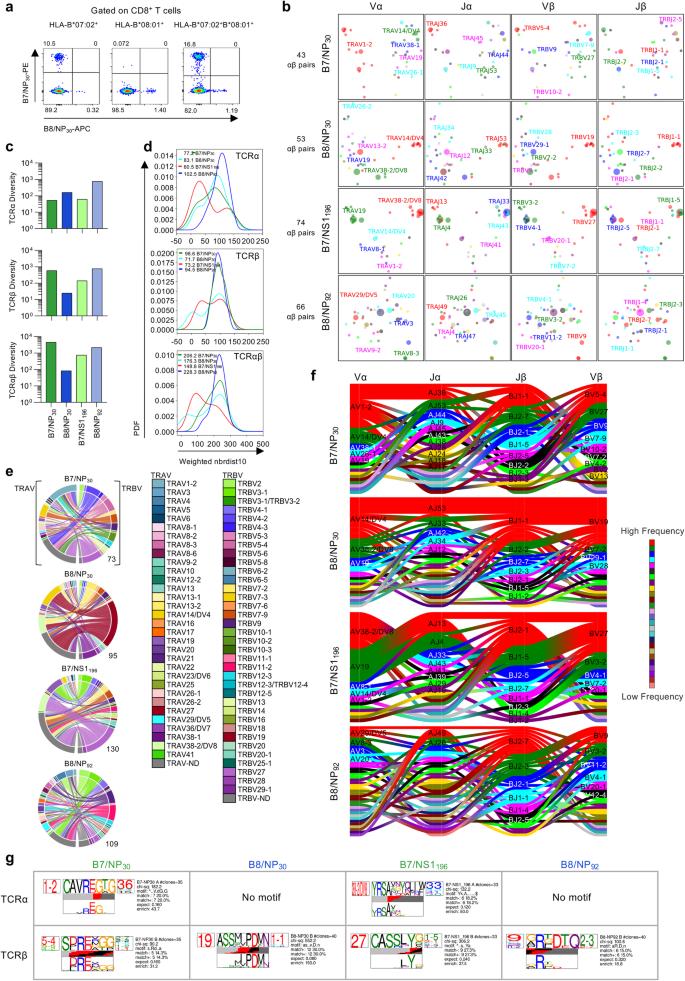
a FACS plots of HLA-B*07:02+HLA-B*08:01+ individuals after dual B7/NP30 and B8/NP30 tetramer staining and enrichment. b 2D kernel principal component analysis (kPCA) projections of B7/NP30+CD8+, B8/NP30+CD8+, B7/NS1196+CD8+ and B8/NP92+CD8+ TCR landscapes colored by Vα, Jα, Vβ and Jβ gene usage (left to right). c TCRdiv diversity measures of the TCRα, TCRβ or paired TCRαβ chains. d Smoothed density profiles of neighbor distance distribution are shown for each epitope. Lower peaks indicate more clustered IBV-specific CD8+ single TCRα, TCRβ or paired TCRαβ repertoire, with average distance values depicted within the plot. PFD stands for probability density function. e Circos plots of TRAV and TRBV gene usage per IBV-specific CD8+ T cell population. Left arch segment colors indicate TRAV usage, right outer arch colors depict TRBV usage. Connecting lines indicated TRAV-TRBV gene pairing and are colored based on their TRBV usage and segmented based on their CRD3α and CDR3β sequence, the thickness is proportional to the number of TCR clones with the respective pair. The number of sequences considered for each circos plot is shown at the right bottom. f Gene segment usage and gene-gene pairing landscapes, vertical stacks indicate V and J segments and gene pairing indicated by curved paths, thickness is proportional to the number of TCR clones within the respective gene pairing. Genes are colored by frequency within the repertoire. g Top-scoring IBV-specific CD8+ CDR3α (top TCR logo) and CDR3β (bottom TCR logo) sequence motifs for each IBV-specific CD8+ T cell population (columns). Each logo depicts the V- (left side) and J- (right side) gene frequencies with the CDR3 amino acid sequence in the middle with the full height (top) and scaled (bottom) by per-residue reparative entropy to background frequencies derived from TCRs with matching gene-segment composition to highlight motif positions under selection. The middle section indicates the inferred rearrangement structure by source region (light gray for V-region, dark gray for J, black for D and red for N-insertions) of the grouped receptors. Motif scores were determined by chi-squared, with values above 90 considered significant. Source data are provided as a Source Data file.
This was also reflected by high TCR diversity scores (TCRdiv) for single TCRα, TCRβ and paired TCRαβ repertoires relative to B8/NP30 (Fig. 9c). Neighbor distance distributions were calculated to measure the density within each epitope-specific TCR repertoire and quantify the relative contribution of clustered and diverged TCRs. Lower average values of the distance distribution peak represented a more similar clustering of clonotypes (Fig. 9d). The level of clustering greatly varied between the studied IBV epitope-specific CD8+ T cell populations. A bimodal distribution that was mainly driven by the TCRβ chain was observed for B8/NP30, whereas the bimodal distribution of B7/NS1196 was driven by both the TCRα and β chain. In contrast, B7/NP30 TCRαβ had an overall lower similarity in clustering of the paired TCRαβ clonotypes, which was mainly driven by high diversity in the TCRβ chain. Highest diversity was however observed for B8/NP92 (Fig. 9d). Overall, 2–8 clonotypes were expanded per donor per epitope (Supplementary Tables 6–9). Very little clonotype sharing was observed, indicative of private TCR repertoires.
To understand whether the observed differences in TCRαβ diversity were related to gene segment usage, V and J genes (Vα, Vβ, Jα, Jβ) were analyzed for each epitope (Fig. 9e, f and Supplementary Fig. 5c). B7/NP30+ TCRαβ repertoire revealed a preference for the TRAV1-2 gene segment and a diverse TRBV gene usage, consistent with our finding of the TCRα chain driving clustering in our neighbor distance analysis. TRAV1-2 usage was observed in 5/6 donors (regardless of whether they co-expressed HLA-B*07:02 and HLA-B*08:01) but was particularly prominent in two donors (A10 and A27). B8/NP30+CD8+ TCRαβ repertoire was dominated by TRBV19-expressing clonotypes detected in all 5 donors and was frequently paired with TRBJ1-1 and TRAV14/DV4 and diverse TRAJ usage. The B8/NP30+ CD8+ TCRαβ repertoire was more diverse in donors who co-expressed HLA-B*07:02, suggesting that co-expression of these alleles may alter the B8/NP30+ TCRαβ repertoire52,53. B7/NS1196+CD8+ TCRαβ repertoire was dominated by TRBV27-TRAV38-2/DV8 expressing clonotypes paired with a variety of TRAJ and TRBJ gene segments and was detected in 3/6 donors (Fig. 9e, f and Supplementary Fig. 5c). TRAV19-expressing clonotypes were also observed in all donors but paired with different TRAJ, TRBV and TRBJ gene segments, which matched the two clusters in the kPCA projections. In line with the kPCA and neighbor distance distribution analysis, the B8/NP92-specific TCRαβ repertoire was highly diverse in gene usage.
In summary, all IBV-specific TCRαβ repertoires were relatively diverse, with pockets of clustering clonotypes observed for B7/NP30, B8/NP30 and B7/NS1196, but not B8/NP92-specific T cells. Furthermore, B7/NP30+CD8+ and B8/NP30+CD8+ T cells have vastly distinct pHLA-I specificities as confirmed by their different gene segments and distinct TCRαβ repertoires.
Distinct CDR3αβ motifs of HLA-B*07:02 and HLA-B*08:01-restricted CD8+ T cells
The TCRs hypervariable complementarity-determining region 3 (CDR3)α and CDR3β regions often mediate the fine pHLA class I specificity. We therefore used TCRdist to dissect the CDR3αβ clonotypic signatures by establishing their amino acid motif similarities to highlight key conserved residues that drive IBV epitope-specific TCR recognition (Fig. 9g). We identified a single TRAV1-2-TRAJ36-associated CDR3α-“CAVREGTG” motif (CDR3α chi-squared (chi-sq) 182.2) and a weaker TRBV5-4-associated CDR3β-“SDRExGG”-motif (chi-sq 90.2) for B7/NP30+CD8+ TCRs. Neither motif was among the high frequency clonotypes, as their prominence was mainly driven by singletons (Supplementary Tables 5 and 6). For B8/NP30+ CD8+ TCRs, only a strong TRBV19-TRBJ1-1-associated CDR3β-“ASSxxPDMN” motif was identified (chi-sq 552.2), which was present in high frequency clonotypes in 3 donors or singletons in one other donor (Supplementary Tables 5 and 7). B7/NS1196-206-specific CDR3α motifs were dominated by a TRAV38/DV8-associated CDR3α-“YRSAxxYxLIW/F” motif (chi-sq 132.2), highly prevalent clonotypes in 1/6 donors and singletons in 2/6 donors, while a strong TRBV27-associated CDR3β-“CASSLYx” motif (chi-sq 306.2) was detected in highly prevalent clonotypes in 2/6 donors and singletons in 4/6 donors (Supplementary Tables 5 and 8). B8/NP92+CD8+ TCRs displayed a TRBJ2-3-associated CDR3β-“xRxDTQ” motif, identified among high prevalent clonotypes and singletons (Supplementary Tables 5 and 9). No B8/NP92+CD8+ CDR3α motifs were identified.
Overall, CDR3αβ motifs within HLA-B*07:02 and -B*08:02-restricted CD8+ T cell populations are distinct and present in either high prevalence clonotypes or singletons.


 Malaysia
 Argentina
  Australia
  Austria
  Brazil
  Canada
  Germany
  Ireland
  Italy
Italy  Mexico
  New Zealand
  Poland
  South Africa
  United Kingdom
  United States


